How to Capture Product-Market Fit Metrics and Act Upon Them to Grow Your Company
It's never a good idea to leave Product-Market Fit to chance. That's why having a quantitative methodology to figure it out will save you time, money, and frustration.


There are a lot of definitions of Product-Market Fit (PMF) but the most cited description comes from this passage in Marc Andreessen’s 2007 blog post, which I found via Rahul’s Product-Market Fit Engine Post:
You can always feel when product/market fit is not happening. The customers aren't quite getting value out of the product, word of mouth isn't spreading, usage isn't growing that fast, press reviews are kind of ‘blah,’ the sales cycle takes too long, and lots of deals never close.
How many of us entrepreneurs have felt the above? I’d venture to say all of us. That’s why it’s vital, in fact, the most important thing to understand is when what you have built can be spread like a viral TikTok dance. Of course, a lot of this viral spreading depends in large part on having both a compelling product and a compelling story about said product.
So, what is Product-Market Fit?
The Marc Andressen quote makes for a great ‘feeling’ of Product-Market Fit, but what exactly is it? Your product is a mirroring of a market need (if it’s successful). It’s a reflection of the market’s problems via a solution; a particular demographic, age group, societal acceptance, and/or religious acceptance.
When you’re achieving Product-Market Fit, you’re really just hitting the nail right on the head for the group of folks that really need it. You’ll see later in this post the methodology on how you can measure and track PMF, but before we get into that we’re going to go through the brand story.
Knowing When You Have Your Story Straight
Nowadays, it’s the branding and messaging that will win the day. Product is essentially democratized since the Low Code, No Code, and Zero Code movements have made building pretty much anything as simple as a weekend hack-a-thon. Well, maybe not that simple but if the growth of MarTech companies is any indication, I’m at least half right.
That’s why it’s important to create a story around your product so that you can spread said story far and wide. Here at The Story Funnel, we call this the Brand Story Guide and the critical component of it is your Big Idea.
What’s the Big Idea?
The Big Idea is your elevator pitch on steroids. It’s meant to be said within ten seconds at a reasonable talking pace. The goal of the Big Idea is to be easily spread. Creating your brand’s Big Idea is a simple process that’s part of the Brand Story Guide, which you can start for free.
The reason this is so important for Product-Market Fit is that you want customers to be able to share your Big Idea far and wide. This means it has to be clear, concise, compelling, and simple to repeat. While you may think your Big Idea is one thing, your customers might think something different. That’s an additional super power of the PMF Survey – you’ll understand what your most loyal customers are resonating with.
Creating a Product-Market Fit Survey
The premise of a PMF survey is to ask your customers what they think of your product in a way that indicates if they can’t live without it. The number of customers does not need to be big in order to gain some insights. In fact, if you receive as little as 10-20 responses, you will be able to get some valuable insights on how to scale.
Our PMF Survey methodology is based on the excellent blog post by Rahul Vohra, the CEO of Superhuman, which we detailed above. In it, he details several questions that determine whether or not your product has achieved PMF. The most important one being the first questions, which is:
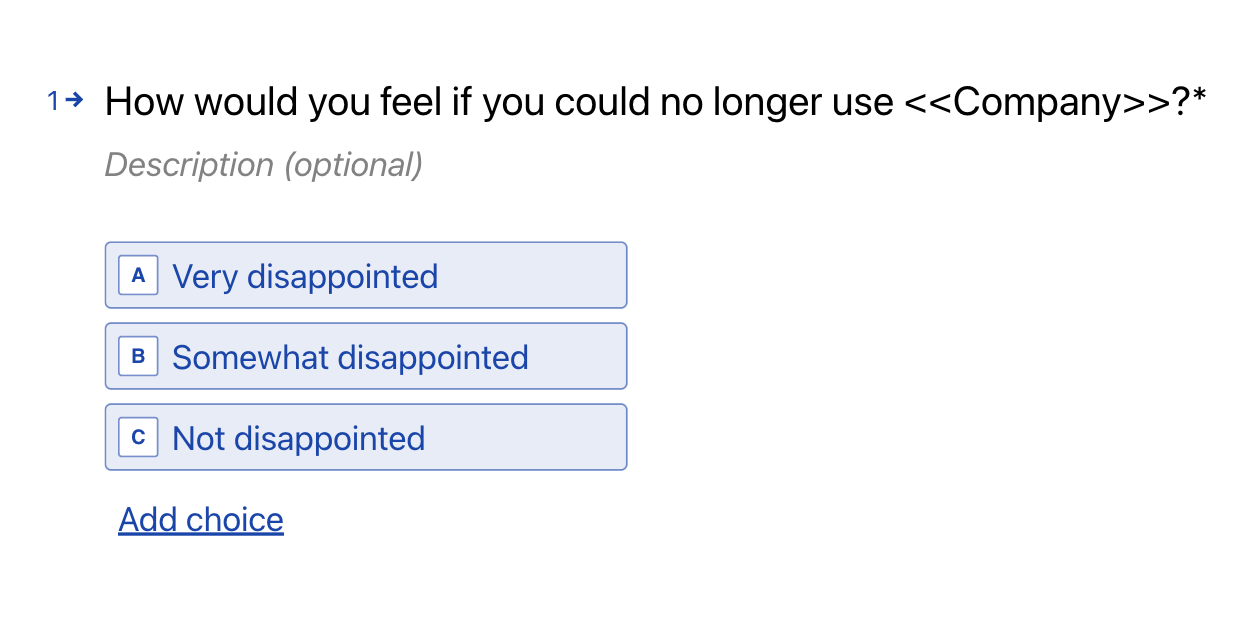
This single question is the most important and allows you to slice and dice the other questions to reveal insights that you would never get using a traditional Net Promoter Score (NPS) survey.
The reason this question is so important is that it triggers our loss aversion, which is two to ten times as strong as when we gain. This allows the “signal” to jump above the “noise” so that actionable insights can be taken.
Loss aversion is what we’re going to use to determine PMF and when we’re ready to scale simply because we want to understand the deep need we fill and the pain we solve. Understanding that is how you write messaging that helps grow and fix product issues that reduce friction.
Additional PMF Questions
While question #1 is essential to a well done PMF survey, it’s not the only question. In order to sort out what to work on and what to message, the following other questions must also be present.
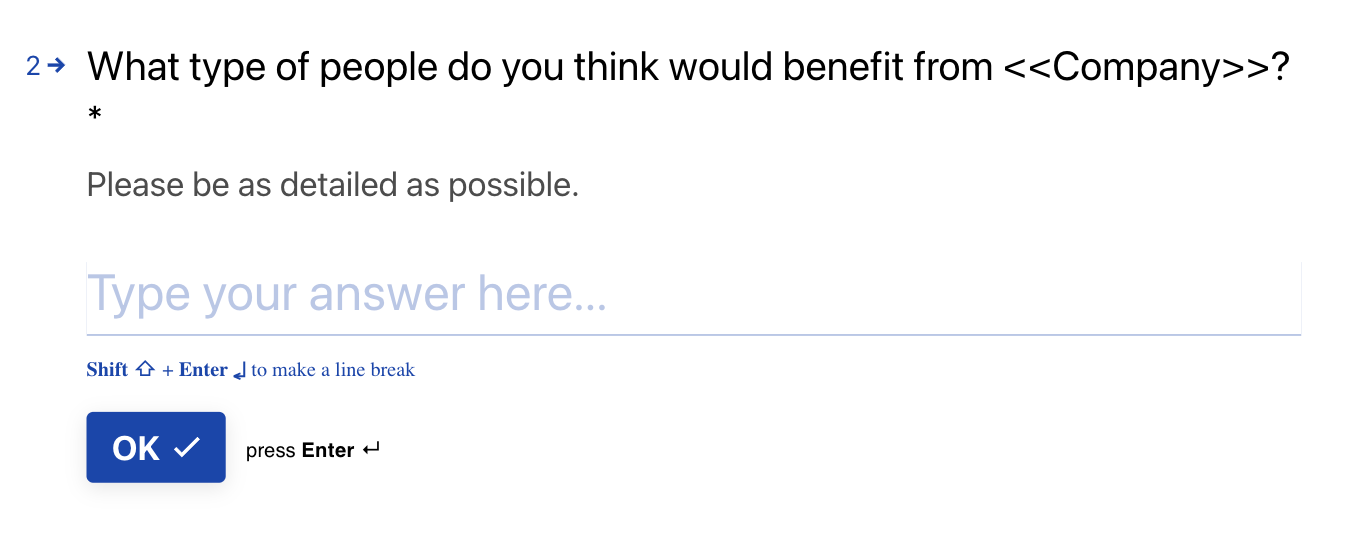
The second question is key for our marketing and sales folks. Notably, when a person is asked “who would most benefit from this product”, they’ll obviously describe themselves.
Imagine having all of your users define themselves. You can plug that right into Facebook ads for demographic targeting, or A/B test subject lines based on your users definitions.
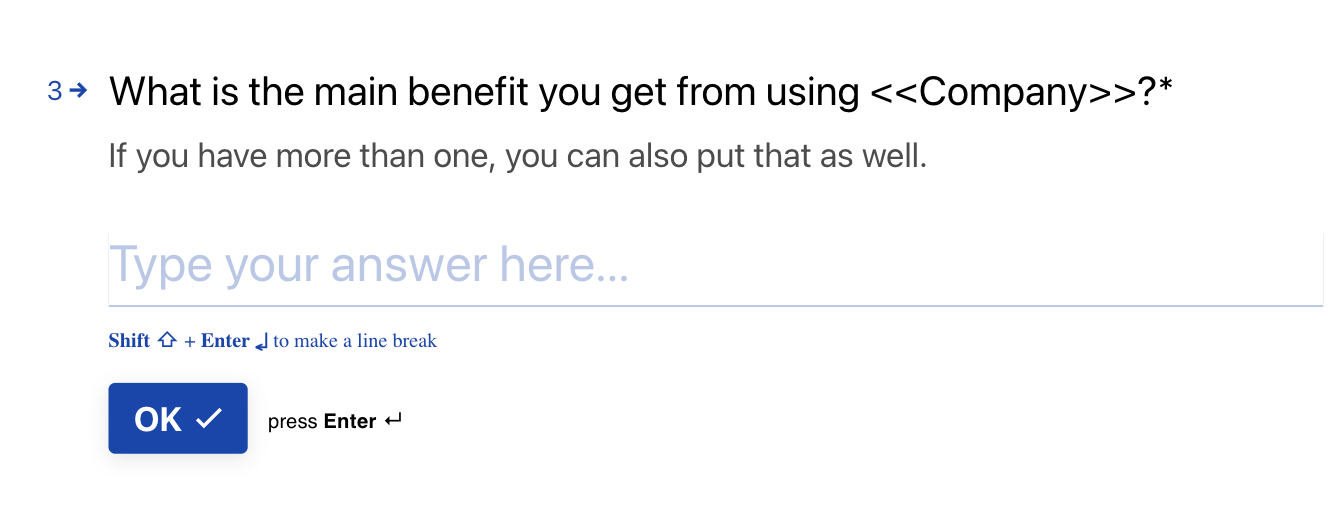
The third: “what is the main benefit you receive,” is good to see if issues brought up in the fourth question (which we’ll go to next), after being fixed, are being brought up as things that you’re doing right.
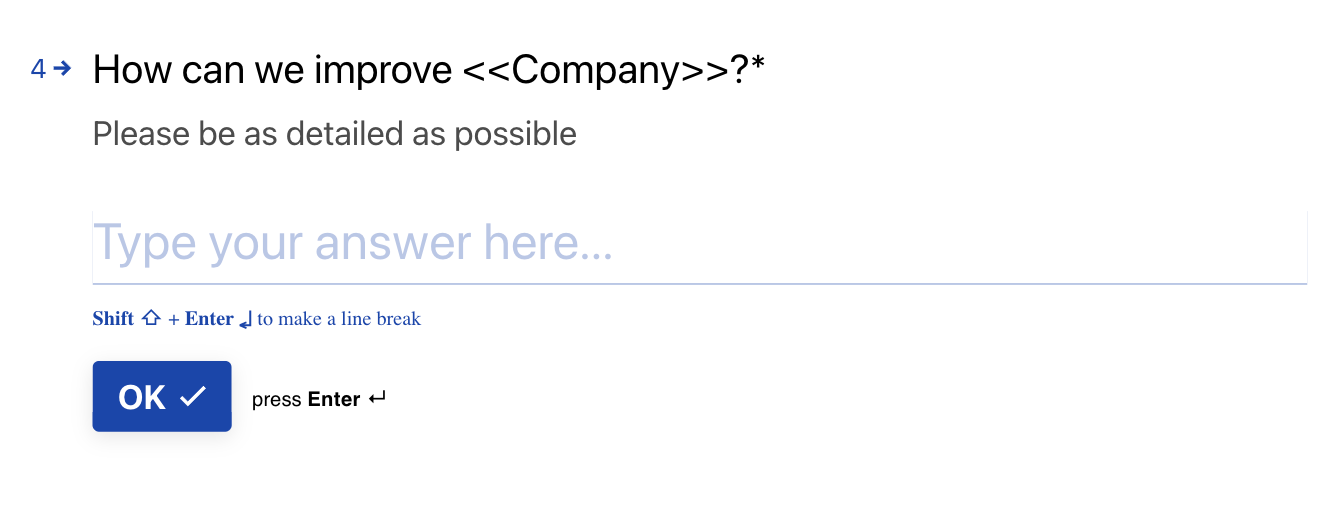
The fourth: “how can we improve,” is a perfect roadmap for the product team to focus on features that are catering to the Very Disappointed cohort. You always want to weigh products, features, and marketing towards this cohort - especially when you’re early in launching your product.
Overall, these questions seem simple enough and they are. That’s what gives this methodology its power. It takes roughly 2-3 minutes for a customer to fill out and they can say whatever they want.
Having an open answer question allows for an unlimited amount of responses, which expands the amount of feedback you can get. A big mistake when creating surveys like this is using multiple choice answers to bias the results.
Of course, this is harder to analyze but what we have found is that it gives richer insights that can surprise you. We’ll talk more about that later when we look at some actionable results.
You can add additional questions to your survey (like the traditional NPS question) but we would recommend doing that after these four questions. The reason being you want the focus to be on answering these up front and leave any other questions (like email or NPS) to the end. We also recommend making any additional questions optional as well.
For our survey engine, we use TypeForm since it’s super easy to use and looks awesome on mobile. Their analysis capabilities are limited so we use our own Machine Learning (ML) models and Human Learning (HL) to do our analysis.
When to Send Out Your PMF Survey
The general rule on when to send out your PMF survey is after your new customers have been onboarded to your product and are actually using it. The exact time when that happens will vary depending on the product. In general, you want the folks that have been using your product enough to get a sense of how it works and how useful it is to them.
If you have a free trial then the best time to send it out would be after the free trial ends since the customers that fall off before that were probably not that serious anyway. The whole goal is to get honest feedback from as close to paying customers as you can. That feedback will be the highest signal you can get.
Analysis of PMF Results
A PMF survey is one that’s meant to be continuously looked at over time, so that you can see progress as you refine your product. At Sutro, which is where we first implemented this process, we send out a PMF survey two weeks after a customer has received and installed the product. We look at the data each month as an OKR on how well things are going.
The OKR is as simple as the breakdown to question #1 and how is it trending over time.
The rest of the analysis is a blend of our own ML models and our HL to extract out a summary of the trends so we can make the product experience as frictionless as possible.
The goal of tracking PMF over time is to understand when to stop developing and start marketing in earnest the product. Of course, with new features and functions, this might change over time but the value in knowing when to shift from development to marketing will not only allow you to grow faster but also save you time and money in not growing the wrong thing at the wrong time.
When to Stop Developing & Start Marketing
For Product-Market Fit, or rather when to stop developing and start marketing, can be thought about as a variant of the Optimal Stopping Problem, which is also known as the Secretary Problem or the 37% Rule.
Simply stated, if you want to pick a candidate for any position, you should spend 37% of your allocated time exploring candidates for the position and after such time, pick the next best candidate you see based on what you previously explored. This idea can be applied to PMF in the following way.
Let’s say you have a set of customers that have used or purchased your product. You want to know if your product is useful to those customers so you can then expand or launch into the market. When is the best time to do that?
Since we have a candidate already picked out (the product) and we have a set of customers that have used the product (the market), we can then figure out when the right time would be by asking customers if they would be Very Disappointed if they could no longer use the product. We do it this way because we want to use the psychological phenomenon of loss aversion to get a clear signal as to what the loss of not using our product would do.
Getting a Clear Growth Signal
Since we know from the Optimal Stopping Problem that we should spend 37% of our time exploring or in this case developing the product, we can set that as the threshold for the percentage of customers that would be Very Disappointed if it went away. Thus, when you hit the 37% threshold, you have achieved PMF for those customers and should be able to expand your customer base.
You can also see how doing this sort of Product-Market Fit survey approach at a regular interval would also show how well your expansion is going or how fast you’re fixing the issues that prevent PMF. This validates the assumption that there has been enough time to achieve Product-Market Fit, which is a constant struggle for startups.
Are You Innovating or Expanding Fast Enough?
Conversely, let’s say you had a Product-Market Fit Score above 63% (100% - 37%), this might indicate that you’re not expanding fast enough or you’re not innovating enough in your market. We don’t have any proof of this but it would seem logical that a balance between innovation and expansion would exist. The idea would be to expand as fast as is optimum to keep up with your new customers’ wants and needs all while not pissing off your long-time customers. Again, we don’t have any proof of this but we’ll be looking into that as time goes on.
Respona’s Product-Market Fit Survey
Let’s take a brief look at a Product-Market Fit Survey we did for Respona. We’re big fans of Respona and it was awesome to see that they hit 67% Very Disappointed (on 30 responses).
Digging a little deeper, it was obvious that folks really loved using Respona because it automated the drudgery of outreaching for link backs and guest posts. It was so helpful that the question on if you would recommend Respona to a friend was 8.6 out of 10 with 46% of those folks already recommending it to a friend at the time the survey was done.
Take a look at the results to see what other insights they received. Talking to Farzad, one of Respona’s founders, he said it validated they were on the right track and also allowed them to focus on some key features before they got out of beta.
Sutro Connect Product-Market Fit Survey
We have been tracking PMF data at Sutro for the last 10 months. The first survey we did showed a 37% Very Disappointed result with 155 respondents. Clearly this was right on the edge of PMF and the main issues revolved around battery charging, the accuracy of the results, the app, and connecting to WiFi.
These themes continued on over the months with the Very Disappointed results dipping to as low as 29% in July of 2021. The biggest complaint was “Accurate Readings and Consistent Test Results” from 161 respondents that month.
As you can see from the graph below (green is Very Disappointed), the metric is bouncing around early on but the trend is clear – there were issues that needed to be addressed before scale could be achieved.
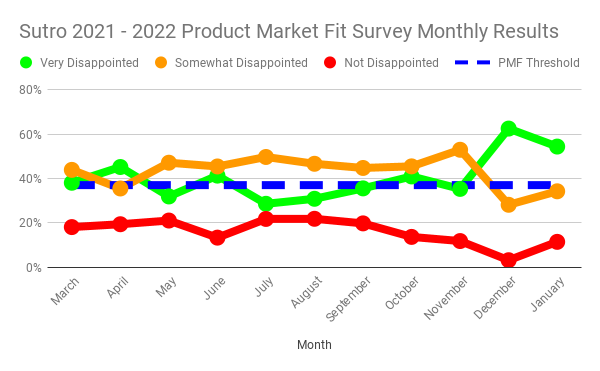
After the issues were identified and fixed, you see a gradual trend upward starting from July on till October with a brief dip in November. The rise in both December and January was because of the final fixes to the product and the excellent coordination between RevOps (Sales, Marketing, and Customer Service) and Product development to communicate issues and fit them.
The total number of PMF survey responses for the 10 months was over 1,100. The survey was usually delivered 2 weeks after a customer was up and running with measurements being reported to their app.
This effort results in Sutro growing from $0 to 7-figures in revenue in 12 months and then doubling revenue again in another six months. The bulk of that revenue growth happened during the period shown on the graph.
Using PMF to Build a Growth Flywheel
Growing a startup is a challenge even in the best of times. Building a growth flywheel requires both a quantitative and qualitative approach along with aligning your RevOps team and your product team. Using a PMF survey is a great way to align both groups and work on what’s important without blowing budgets, creeping features, and annoying your customers. Building this growth flywheel takes time and energy but it pays off when you can see all of your hard work pay off.
Want to build your own growth flywheel? The first step on your journey to a growth flywheel is to get your story straight. You can start doing that for free by signing up for an account and sending your team the Brand Story Guide Survey.
Links to Explore
Here are some links that we found useful in writing this post. Some are already in the body of the post but we wanted to have a single place for all things Product-Market Fit.
- The Startup Pyramid: The base of the Pyramid is Product-Market Fit.